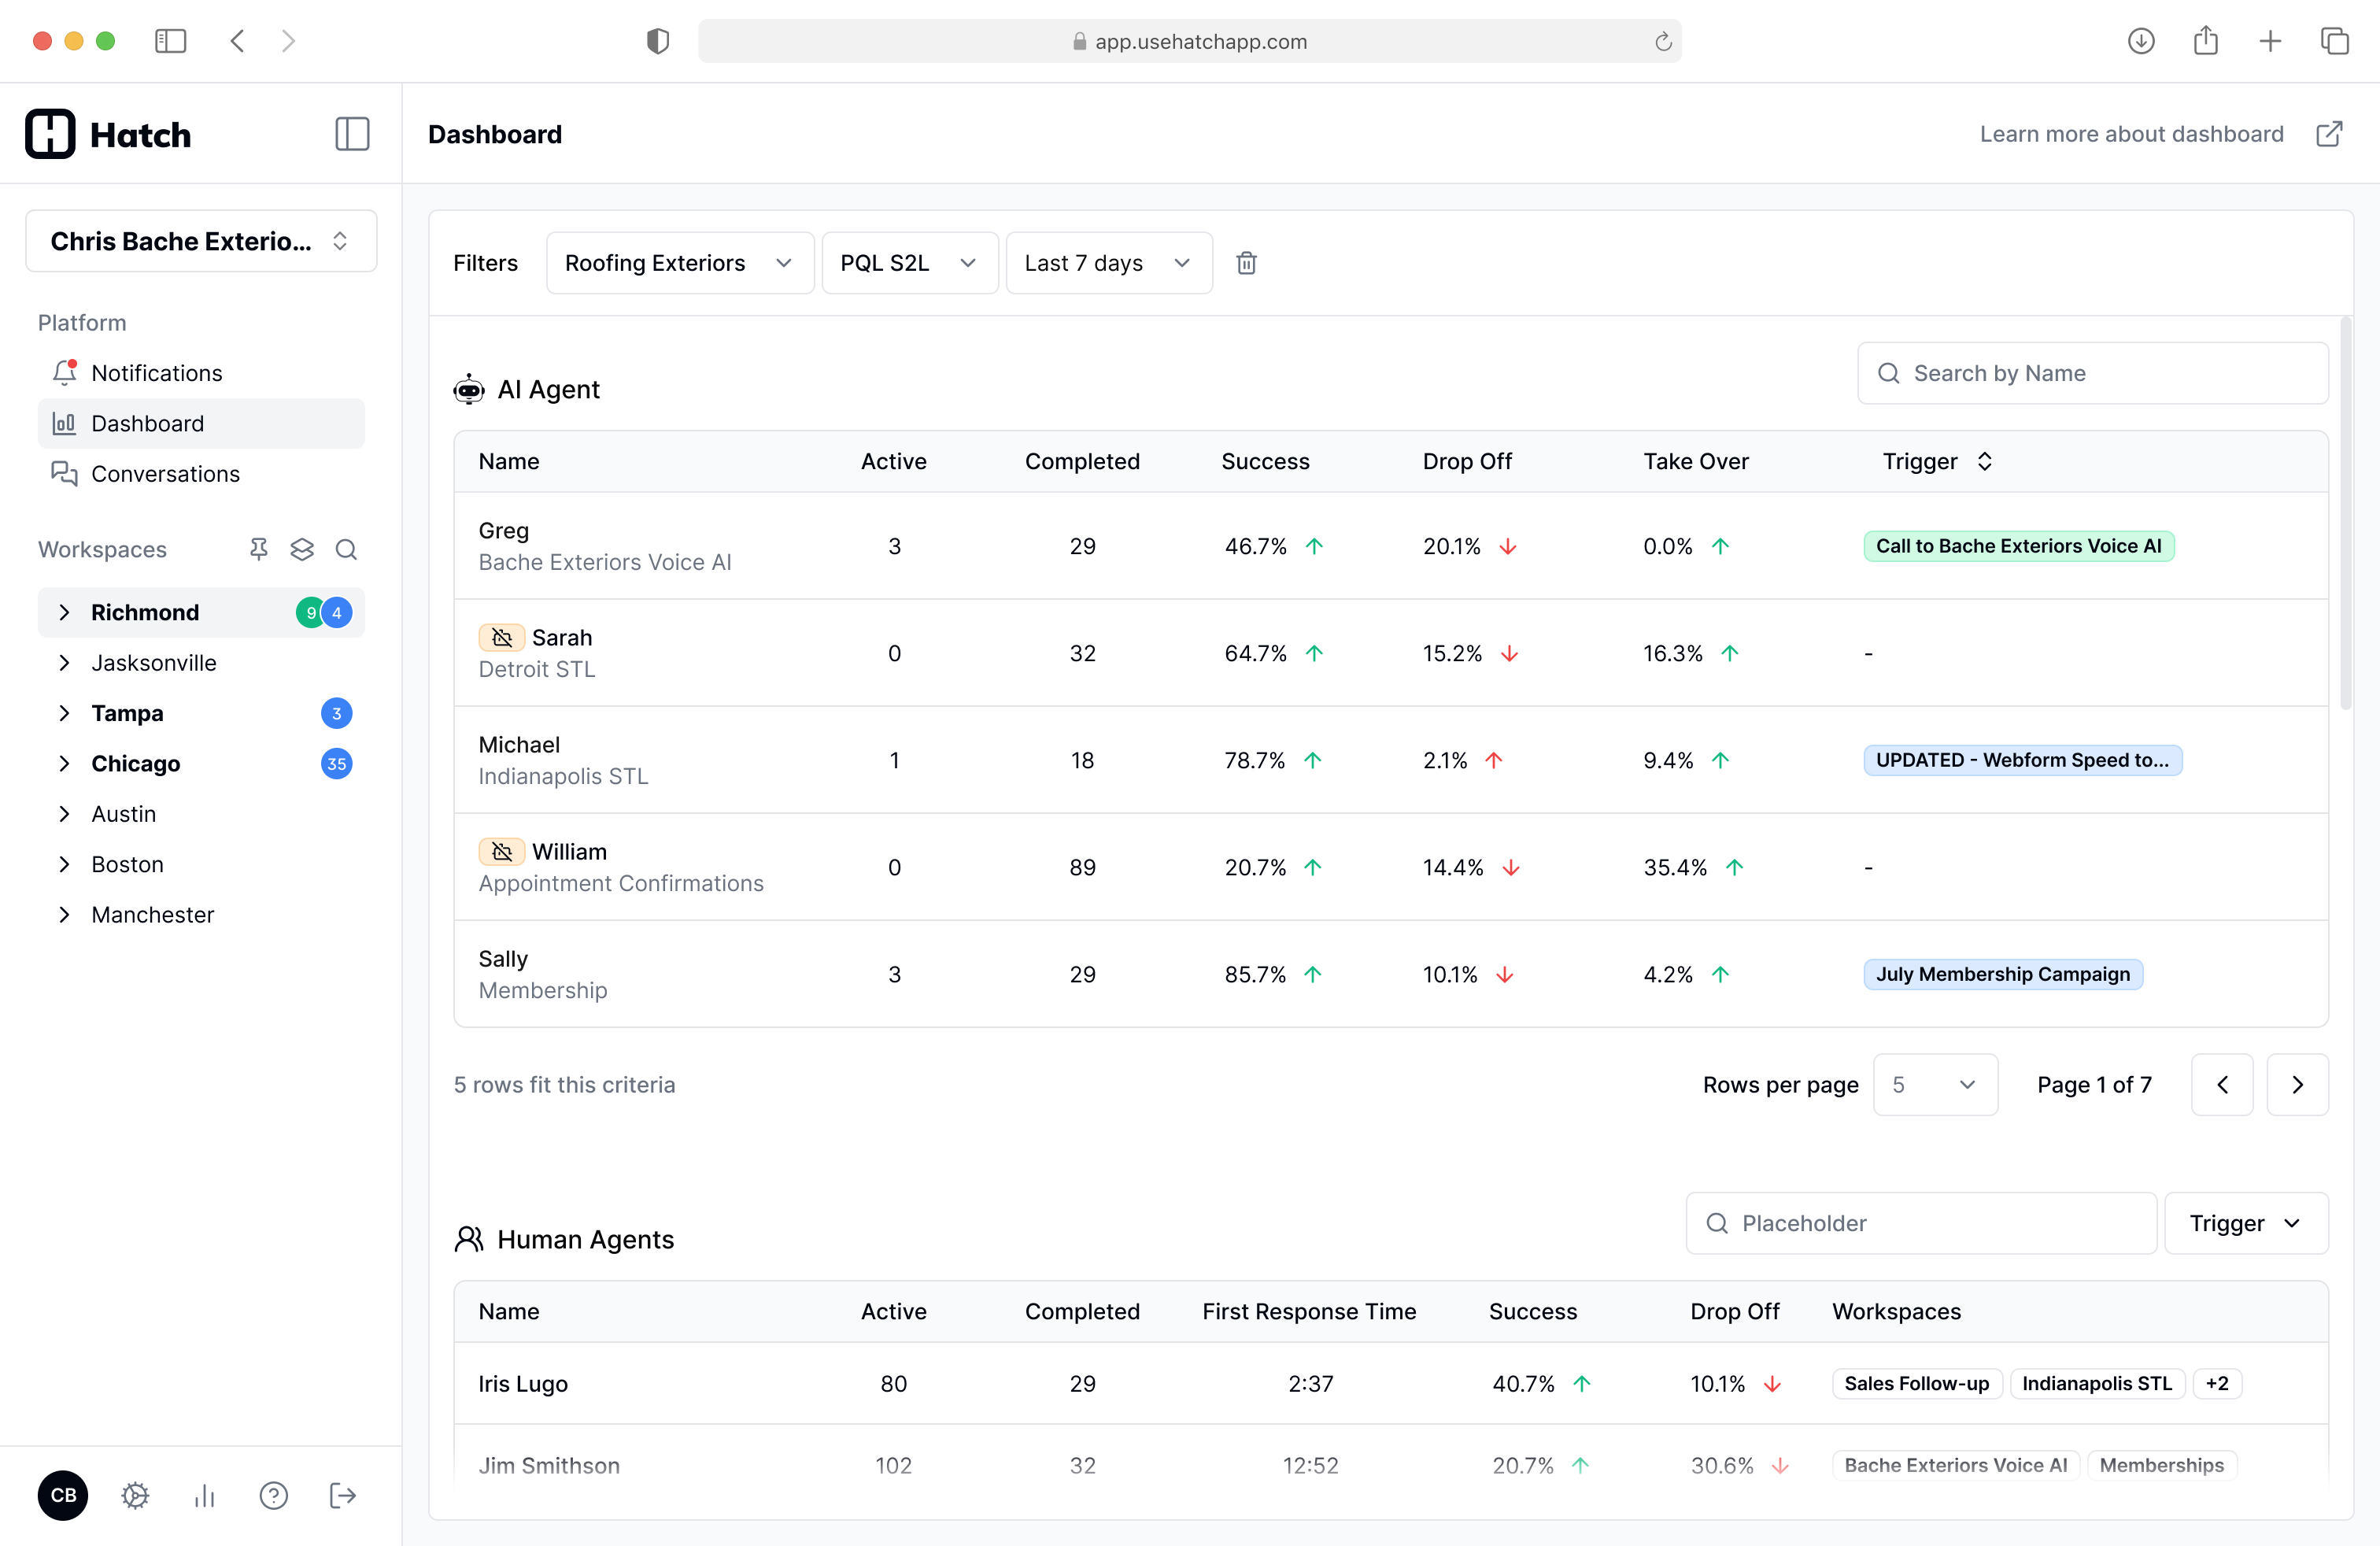
What you can do now
- Track how many conversations each agent is handling.
- Monitor performance metrics such as success and drop-off trends.
- Click into any agent to view the specific conversations they have had.
How metrics are calculated
Dashboard metrics are based on the dispositions applied at the end of each conversation. “Success” is determined by your configured dispositions in settings. You can mark specific dispositions as successful, and Hatch uses that configuration to calculate success-related metrics.- Mark relevant chatbot dispositions as “successful”. (Under Settings -> Dispositions)
Real-time updates
Dashboard metrics and agent activity update in real time, so you can monitor performance as conversations happen.Workflow: Audit a bot’s performance
Once a bot’s prompt and dispositions are properly configured, you can quickly review how it is performing and see the outcomes it is driving.- Open the Dashboard.
- Click the bot (agent) you want to review.
- Hatch routes you to the Conversations page with filters pre-applied for that agent.
- Review the list of conversations and their disposition outcomes.
- Click any conversation to open the full thread and context on the Contact page.